TL;DR
What makes a KPI actually worth tracking in field service?
A metric becomes a KPI when it’s directly tied to an outcome you care about – profit, productivity, or customer experience.
That’s why frameworks from field service leaders consistently highlight areas like first-time fix, on-time performance, workforce utilisation, and customer satisfaction as core performance markers.
A KPI is worth tracking if it clearly improves one of these:
- Customer outcome: Did we show up when we said we would, and fix it properly?
- Operational outcome: Did we use time and travel efficiently?
- Financial outcome: Did the job make money, and did we get paid fast?
It’s important to beware of leading vs lagging KPIs. Leading KPIs warn you early, such as travel time, schedule adherence, and time to invoice. Lagging KPIs confirm results (they show up after the fact): customer satisfaction, margin trends, repeat work.
Remember only one rule: track fewer KPIs, but review them consistently and act on them.
If you’ve ever opened a spreadsheet of KPIs for field service and thought, mate, I’ve got jobs to run, you’re not alone. Most trade and service businesses don’t have a KPI problem; they have a signal vs noise problem.
The point of KPIs isn’t to report more. It’s to make better calls on the stuff that moves the needle: fewer return visits, more jobs done per day, happier customers, and healthier cashflow.
Here’s the truth: the most important KPIs for field service are the ones you can influence weekly, not the ones that look fancy in a monthly report.
The KPIs that matter most
Below are the KPIs for field service that tradies can actually use, a simple way to calculate them, and practical levers to improve them.
1. First-Time Fix Rate (FTFR)
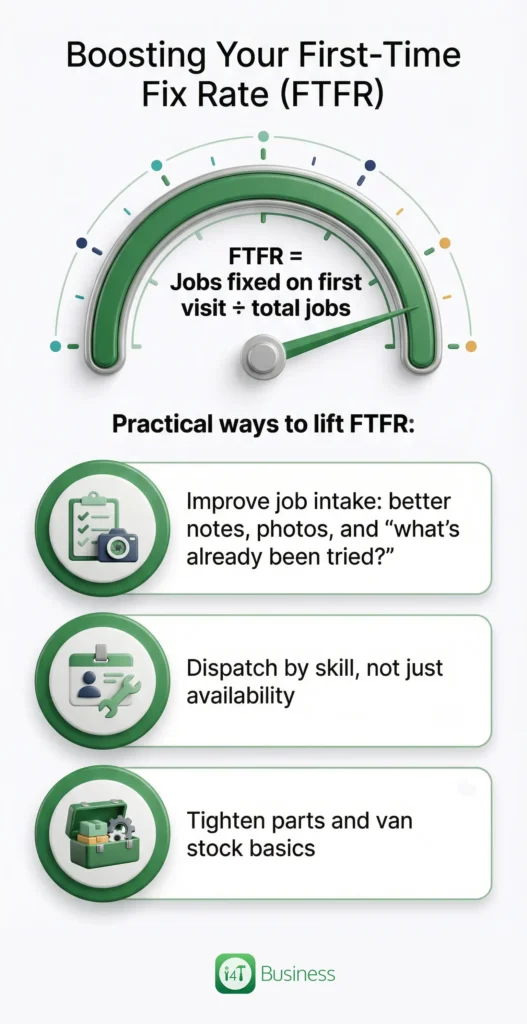
This tells you how often you finish the job properly on the first visit, in terms of quality and efficiency.
It’s calculated as below:
FTFR = Jobs fixed on first visit ÷ total jobs
Every return visit eats into tomorrow’s schedule and quietly destroys margin. Top performers consistently achieve higher first-time fix rates than average businesses.
Practical ways to lift FTFR):
- Improve job intake: better notes, photos, and “what’s already been tried?”
- Dispatch by skill, not just availability
- Tighten parts and van stock basics
If you want one KPI that improves both customer experience and productivity, this is it.
2. On-Time Arrival

This tells you reliability. Are you arriving within the promised window?
It’s calculated as below:
On-time jobs ÷ total scheduled jobs
This is a key separator between average operations and top performers. Late arrivals create a domino effect: upset customers, frantic dispatching, rushed work, and more callbacks.
How to improve it:
- Use realistic job durations instead of under-quoting time
- Add travel buffers in busy suburbs or peak traffic times
- Message customers early if you’re running late
On-time arrival is a trust KPI, and trust is what gets you repeat work.
3. Time to Site / Response Time
This tells you how quickly you can get someone on site after a job is booked or raised.
It’s calculated as follows:
Arrival time − job created/confirmed time
Why it matters: Faster response is often a competitive edge in trade services, especially urgent work. It also reduces cancellations because customers feel looked after.
How to improve it:
- Group jobs by area
- Keep a couple of shorter jobs ready as “fillers” for gaps
- Use smarter scheduling rules – consider availability, location and skill
You don’t need to be the fastest ; you need to be reliably fast.
4. Mean Time to Repair (MTTR)
This tells you how long jobs take once work starts. MTTR is the average time to repair/restore after a failure or issue.
It’s calculated as below:
MTTR = total repair/service time ÷ number of jobs
Lower MTTR generally means more capacity; more jobs completed without adding techs. But chasing speed at the cost of quality will backfire (FTFR will tell you when it does).
How to improve it:
- Standardise job close-out steps like photos, notes, and customer sign-off
- Use checklists for common jobs
- Ensure parts readiness before the tech arrives
MTTR is your “how smooth is the job really?” KPI.
5. Technician Utilisation

This tells you how much of paid time is spent doing productive work, not admin, waiting, or excessive travel.
It’s calculated as follows:
Utilisation = billable or productive hours ÷ available hours
For tradies, utilisation is where you spot hidden waste: long close-out times, double-handling paperwork, or messy scheduling that creates dead gaps.
How to improve it:
- Reduce admin time with mobile job sheets
- Cut waiting time with better booking windows and parts planning
- Minimise back-to-the-office trips with proper job documentation on site
Utilisation doesn’t mean “work them harder”, it means remove friction.
6. Travel Time per job
This tells you how much of your day and fuel is being burned on the road.
It’s calculated as follows:
Travel time ÷ jobs completed
Travel is one of the biggest silent killers in field service because it hits you twice: less time on the tools and higher vehicle costs. Many field service KPI guides explicitly call out travel time as a core lever for dispatch efficiency.
How to improve it:
- Batch jobs by suburb/region where possible
- Avoid “pinball scheduling” (one job east, next job west, then back again)
- Use time windows that reflect reality and communicate them clearly
You can’t “work faster” to beat travel; you have to schedule smarter.
7. Customer Satisfaction (CSAT)

This tells you whether the customer felt the experience was good, not just whether the job got done.
Its method is as follows:
Quick 1–5 rating after the job, plus an optional comment.
CSAT is often described as a lagging indicator. If you’re late, can’t fix it, or take too long, it’s hard to recover the customer’s perception.
How to improve it:
- Confirm arrival times clearly and update when things change
- Set expectations before starting
- Close out professionally with photos, notes, and a tidy site
CSAT tells you whether your operational KPIs are translating into real-world goodwill.
The two money KPIs tradies should never ignore
You can be flat out and still be broke. These two KPIs fix that.
8. Gross Margin per job
This tells you whether each job actually makes money after direct costs – labour, materials, subcontractors.
It’s calculated as follows:
Gross margin % = (job revenue − direct job costs) ÷ job revenue
What it catches (the usual culprits):
- Unbilled labour time
- Materials that never made it onto the invoice
- Repeat visits and rework that quietly erase the profit
Margin per job is the KPI that stops “busy” from masking “unprofitable.”
9. Time to Invoice
This tells you how fast completed work turns into cash flow.
It’s calculated as follows:
Time to invoice = invoice sent time − job completed time
If you want the bigger-picture version, especially for businesses with lots of invoices, track Days Sales Outstanding (DSO), the average time it takes to collect payment after a sale.
How to improve it:
- Invoice from the field as soon as the job’s closed out
- Make approvals and sign-offs part of the job flow
- Reduce disputes with clearer descriptions, photos, and itemised materials
Faster invoicing usually means faster payment and less time chasing.
KPIs you can ignore
Some numbers look impressive, but don’t help you make better decisions. For example:
- Total jobs created, without margin and quality context
- Calls/messages sent often signal confusion, not performance
- “Hours worked”, without productivity and profitability
A good rule: if the KPI doesn’t point to a clear weekly action, park it.
You can be flat out and still be broke. These two KPIs fix that.
How to set targets wisely
The easiest way is to keep your cadence simple. Weekly KPIs should be operational: FTFR, on-time arrival, travel time/job, utilisation, MTTR, and monthly KPIs should include: Monthly KPIs should indicate money and customer outcomes: gross margin per job, time to invoice/DSO, CSAT.
Then ask one practical question in your weekly review: “What’s the one friction point we can remove this week?”
That might be better job intake notes, tighter scheduling windows, or getting invoices out the same day. Tiny changes compound fast when you review the right KPIs.
Track less, act more
If you want the most important KPIs for field service in one line, it’s this:
Track the KPIs for field service that reduce return visits, improve punctuality, cut travel, lift productive hours, protect margin, and speed up payment.
All you need is a workflow that captures the data as part of doing the job.
If you’re keen to track the KPIs that matter without drowning in admin, i4T Business helps you run jobs end-to-end, scheduling, job notes, photos, timesheets, and invoicing, so your performance data is captured once, in the flow of work, and can be reviewed weekly to keep the team productive and the cash moving.
FAQs
First-time fix rate, on-time arrival, time to site, MTTR, technician utilisation, travel time per job, customer satisfaction, gross margin per job, and time to invoice.
Start with 7-9 max. If you can’t review and act on them weekly/monthly, it’s too many.
First-time fix rate (FTFR) – it captures “fixed properly” and avoids repeat visits.
Time to invoice, sending invoices quickly after job completion usually improves how fast you get paid.
A metric measures something; a KPI is the metric tied to a goal you actively manage.